On August 21, 2017, eclipse fever gripped the nation! A total solar eclipse is the Super Bowl of astronomical events, and millions of Americans were treated to a rare natural spectacle. The path of totality was about 70 miles wide, and swept from Oregon to South Carolina over a period of about an hour and a half. Although those who flocked to this narrow band had the most dramatic experience, the entire country was able to view at least a partial eclipse.
The last time a total eclipse happened in the contiguous United States was February 26, 1979, when the path of totality skirted 5 states in the Pacific Northwest and Upper Midwest. The last coast-to-coast total eclipse occurred on June 8, 1918. Both of these events happened before the US solar industry was in full force (or even born), so we thought it would be fun to take a look at how solar photovoltaic (PV) systems reacted to the natural phenomena. The path of totality crossed through several states which do not have a high penetration of solar PV, including Idaho, Wyoming, Missouri, and Tennessee. However, we will look at a few projects just outside the path, as the effect was still clear.
First, a quick primer if you’re not accustomed to looking at solar production curves.
Figure 1 shows power production vs time of day for a small rooftop PV system here in Washington, DC that Sol Systems owns and operates. Three separate days are plotted, showing:
- a sunny day on August 20
- a day with passing clouds on August 28
- a rainy and cloudy on August 29
Figure 1: AC Power production vs time
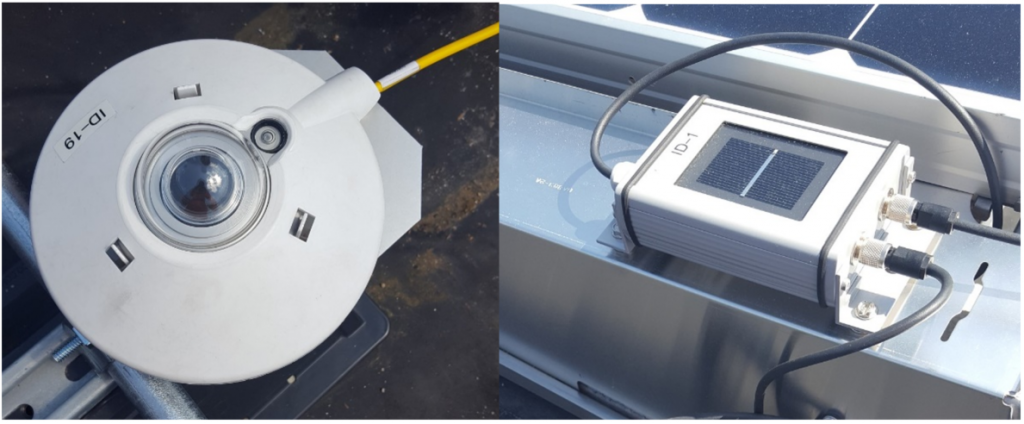
The data from August 20 in particular shows the classic bell-shaped production curve that is typical for clear days on fixed-tilt systems. PV generation is directly proportional to the amount of sunshine received at the site, which is measured with either a pyranometer or a reference cell.
Figure 2: Pyranometer (left) and Reference Cell (right)
Trackers can enhance a PV project’s most valuable resource- solar radiation. Single-axis trackers (SAT) can increase the amount of sunlight hitting the panel’s surface by following the sun’s motion, and therefore the energy harvested, by 15-30 percent compared to a fixed-tilt system. Note the characteristic bi-modal shape of the SAT irradiance curve in Figure 3, which is due to the sun’s position and limitations in motion of the tracker.
Figure 3: Irradiance curves for single-axis tracker and fixed-tilt systems
Ok, back to the eclipse on August 21.
Sol Systems is an investor and also provides Asset Management services on a 6.5MWdc / 5.0MWac fixed-tilt ground mount project located in North Carolina. According to this website, the location saw a 90.9 percent eclipse, peaking at 2:44 pm local time. Figure 4 shows the triangular shaped bite that the eclipse took out of the production curve. The AC Power measured at the system peaked at 1:10pm at 4,869kW and dropped down to 307kW at 2:45 pm, coinciding with the maximum amount of sun coverage. Also shown in Figure 4 is DC electrical data from one of the ten inverters, which demonstrates the eclipse loss was driven by Current, as the Voltage stayed relatively flat except for some minor fluctuations from temperature variation. For the day, the loss due to the eclipse was estimated at 17 percent compared to a sunny day.
Figure 4: North Carolina Solar Farm output and Inverter level data on August 21
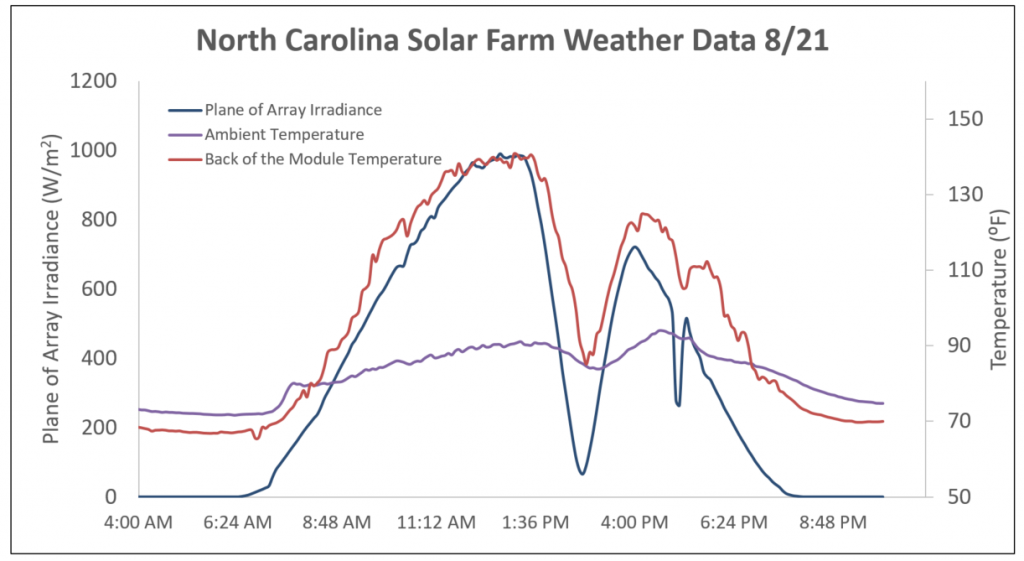
Figure 5 shows the plane of array irradiance, the back of the module temperature, and the ambient temperature. It is interesting to note that the irradiance peaked at 958 W/m2 at 1:10 pm and reached a minimum of 65 W/m2 at 2:40 pm. During the eclipse, the ambient temperature dropped 7⁰F and the module temperature dropped 55⁰F.
Figure 5: North Carolina Solar Farm weather data on August 21
Figure 6 shows data from another project that Sol Systems invested in and currently performs Asset Management services for in Bend, OR. The site is a 14 MWdc / 9.9 MWac project set on a single-axis tracker. Bend was just outside the path of totality, clocking in at a 99.8 percent eclipse. Figure 6 shows the characteristic triangular wedge that was cut out of Neff’s production curve. At its peak, the solar system lost 99.6 percent of power compared to a sunny day, aligning very well with the calculated eclipse percentage. Due to the high DC:AC ratio, inverter clipping is expected on sunny days in the summer; however, the flat-top was not visible due to some passing clouds. At this site, the eclipse loss was calculated to be about 14 percent for the day. 
Figure 6: Oregon Solar Farm weather data on August 21
Sol Systems did finance and deliver one project in the path of totality in Nebraska. Unfortunately, the weather there featured scattered clouds that day and the production curves were not as clean as the ones shown above.
Here in the nation’s capital, Sol Systems employees were treated to a rooftop viewing of the partial eclipse at the Solar Foundation’s building on Pennsylvania Avenue, just steps from the White House. It was rare chance to see one of nature’s most amazing visual spectacles.
ABOUT SOL SYSTEMS
Sol Systems, a national solar finance and development firm, delivers sophisticated, customized services for institutional, corporate, and municipal customers. Sol is employee-owned, and has been profitable since inception in 2008. Sol is backed by Sempra Energy, a $25+ billion energy company.
Over the last eight years, Sol Systems has delivered 650MW of solar projects for Fortune 100 companies, municipalities, universities, churches, and small businesses. Sol now manages over $650 million in solar energy assets for utilities, banks, and Fortune 500 companies.
Inc. 5000 recognized Sol Systems in its annual list of the nation’s fastest-growing private companies for four consecutive years. For more information, please visit www.solsystems.com.


